Many of us have looked at them. Some of us pretend to understand them. Some of us have no idea what I’m talking about. Film Characteristic Curves are provided by most film manufacturers to help describe a film’s behavior. I am an engineer, a rocket scientist even, and I was getting frustrated trying to make sense of these curves. Some web resources described what the different parts of the curves mean and individuals on forums answered questions with authority “It’s obvious from looking at the curves.” Thanks for nothing. I finally buckled down and combined research with my math background to figure out how to put these curves to practical use.
A film’s characteristic curve is a plot of exposed/processed film density (vertical axis) versus exposure (horizontal axis). Density is a relative scale. On the charts it is plotted in log base 10. What this means is that 0 density passes a certain amount of light. A density of 1 passes 1/10 of the original light. A density of 2 passes 1/100 of the original light and so on. I don’t care too much about the details of this except to know when exposure is having a measurable effect on density and thus my image. Exposure is provided in an absolute scale and is plotted in log base 10 lux seconds. A certain influx of light times a time gives you a certain bucket of light, here measured in lux seconds. The logarithmic nature of this scale is the same as that of the density scale. An increase in 1 is 10X more exposure. A decrease by 1 is 1/10 of the original exposure.
Your light meter and camera have their readings and controls in log base 2. A one-stop increase is double the light, two stops 4X. A one-stop decrease is ½ the light. Through math one log scale can be converted to another and that is what I did. The other piece of the puzzle is to know how much absolute exposure a light meter is providing for a given ISO. The answer is contained in the ISO (International Standards Organization) code for film speed. ‘Proper exposure’ as defined by them and programmed into your light meter is: LuxSeconds = 10/ISO . This is the location on the characteristic curve the meter places middle grey. ISO is the slope of the curve, or how fast that film exposes.
OK, so how do I use all of this? Film is useful in the linear region of its characteristic curve. This is the part that is a straight line. If you look at the least and greatest exposure at the tail ends of the straight-line part of the curve, that is your film latitude. Just based on the curves, slide film has an approximate latitude from -3 to +3 stops. Print film from -3 to +7 or so where they tend to stop recording data.
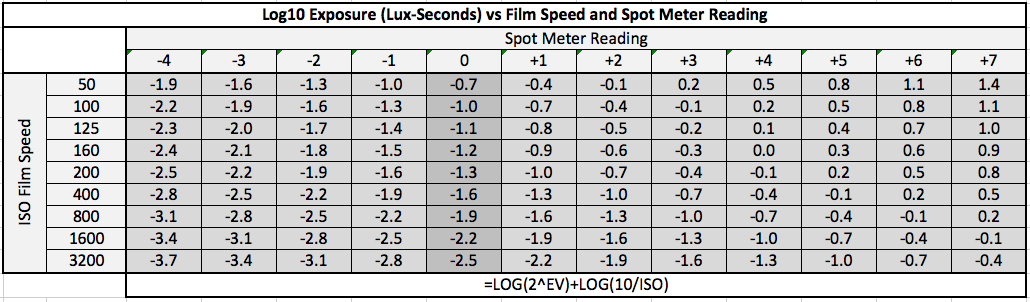
Reading the curve for your particular film will let you dig in and get more precise values. I made a handy chart relating the log2 exposure of your meter to the log10 exposure of the published characteristic curves. It is disappointing that these companies publish data in a different format than that of the tools of their customers, photographers. I will include the formulas so you can calculate more exact values for yourself if you wish.
Explaining My Exposure Vocabulary
I will provide some background to how I think about exposure, which may be different from other people. Under even lighting, if you use a grey card/spot meter or an incident meter you are doing the same thing. You are measuring the light falling onto the scene. Set your mental camera here and now grab your spot meter. Spot meter black paper. It reads an ‘underexposure’ of 2 stops, or in my jargon, -2. Spot white paper. It reads an ‘overexposure’ of 2 stops, or +2. Now spot your grey card. It reads ‘proper’ exposure, or 0. Well that’s great because from interpreting the characteristic curve of my slide film, it records from -3 to +3 stops. OK, so an evenly lit scene falls from about -2 to +2. Say I want a bright feel. I can safely increase exposure by 1 stop by doubling my shutter speed and now my exposure range is from -1 to +3.
Life is never this simple and light is uneven and shadows and highlights are what make photography fun. The most accurate way to fit a scene onto the film is to spot meter the brightest and darkest parts and ‘place’ that exposure range wherever you want within the latitude of the film. It may not always fit and then you have to choose a mood. Maybe you want deep shadows and you place those at -4 because you know that will come out black. In practice it is often not practical to spot meter everything but this system is a great way to communicate exposure. In the studio it is popular and convenient to use an incident meter. Since you now know that any flat-lit scene has an exposure range of -2 to +2, you know that you can increase or decrease exposure by 1 stop, on slide film, from an incident light reading and still be in the clear.
How All of This Applies to Film Specifically
Looking at the curves for slide film you will see the exposure latitude is approximately from -3 to +3 stops. For negative film it goes approximately from -3 to +7 stops. Slide film begins its life with a rich dark density and exposes toward clear. That combined with its narrow exposure range gives it a high contrast and a rich feel. Black and white negative film does the opposite, exposing from near clear and increasing in density toward a rich dark density if proper techniques are applied. Film development techniques can be employed to match the contrast of the negative to that of the scene but this article is focused on standard development. Color negative film exposes from an amber base toward higher density but as can be seen from the curves, the relative density never reaches that of slide film and unsurprisingly prints from color negatives start life with a less-contrasty feel than prints from slide film.
I feel that I have slide film exposure dialed in very well. My goal is either to fit the contrast of the scene onto the slide or when the scene contrast is too high I either know not to shoot or make a decision whether to retain detail in the brightest or darkest areas of the scene. Some photographers are famous for their vivid landscape photographs taken at key times of day that fit the contrast range of slide film. Others make the contrast of the scene fit the film with their use of graduated filters or lighting. Digital photography is most similar to shooting color slide film in terms of exposure.
With negative film, you have much more overexposure latitude than with slide film or digital. This latitude of negative film is often taken advantage of by portrait photographers by increasing exposure from standard by one or two stops. The highlights still fit within the exposure latitude of the film but what was in dark shadow lifts into legible exposure. This gives the images reduced contrast and a more airy feel. Increase exposure too much from standard and you will get color shifts. Some photographers increase exposure just to achieve this effect. Another advantage is for backlit scenes. If you properly expose for your subject, digital or slide film will have blown out highlights in the background. Not so with negative film. I have had success using black and white negative film for night cityscapes. The exposure latitude of the film has allowed me to capture the large exposure range from unlit buildings to brightly lit parts of the scene. Bright areas that I would normally just write off with slide or digital come out surprisingly well exposed in the black and white negative. When it comes to printing you will still have to fit the entire contrast range of the scene onto paper with a contrast range of 4 stops. For this reason it is important to maintain reasonable expectations of the medium. That said, some photographers have made their mark by printing with skill what others have dared not to print.

Conversion Chart
Example Photos
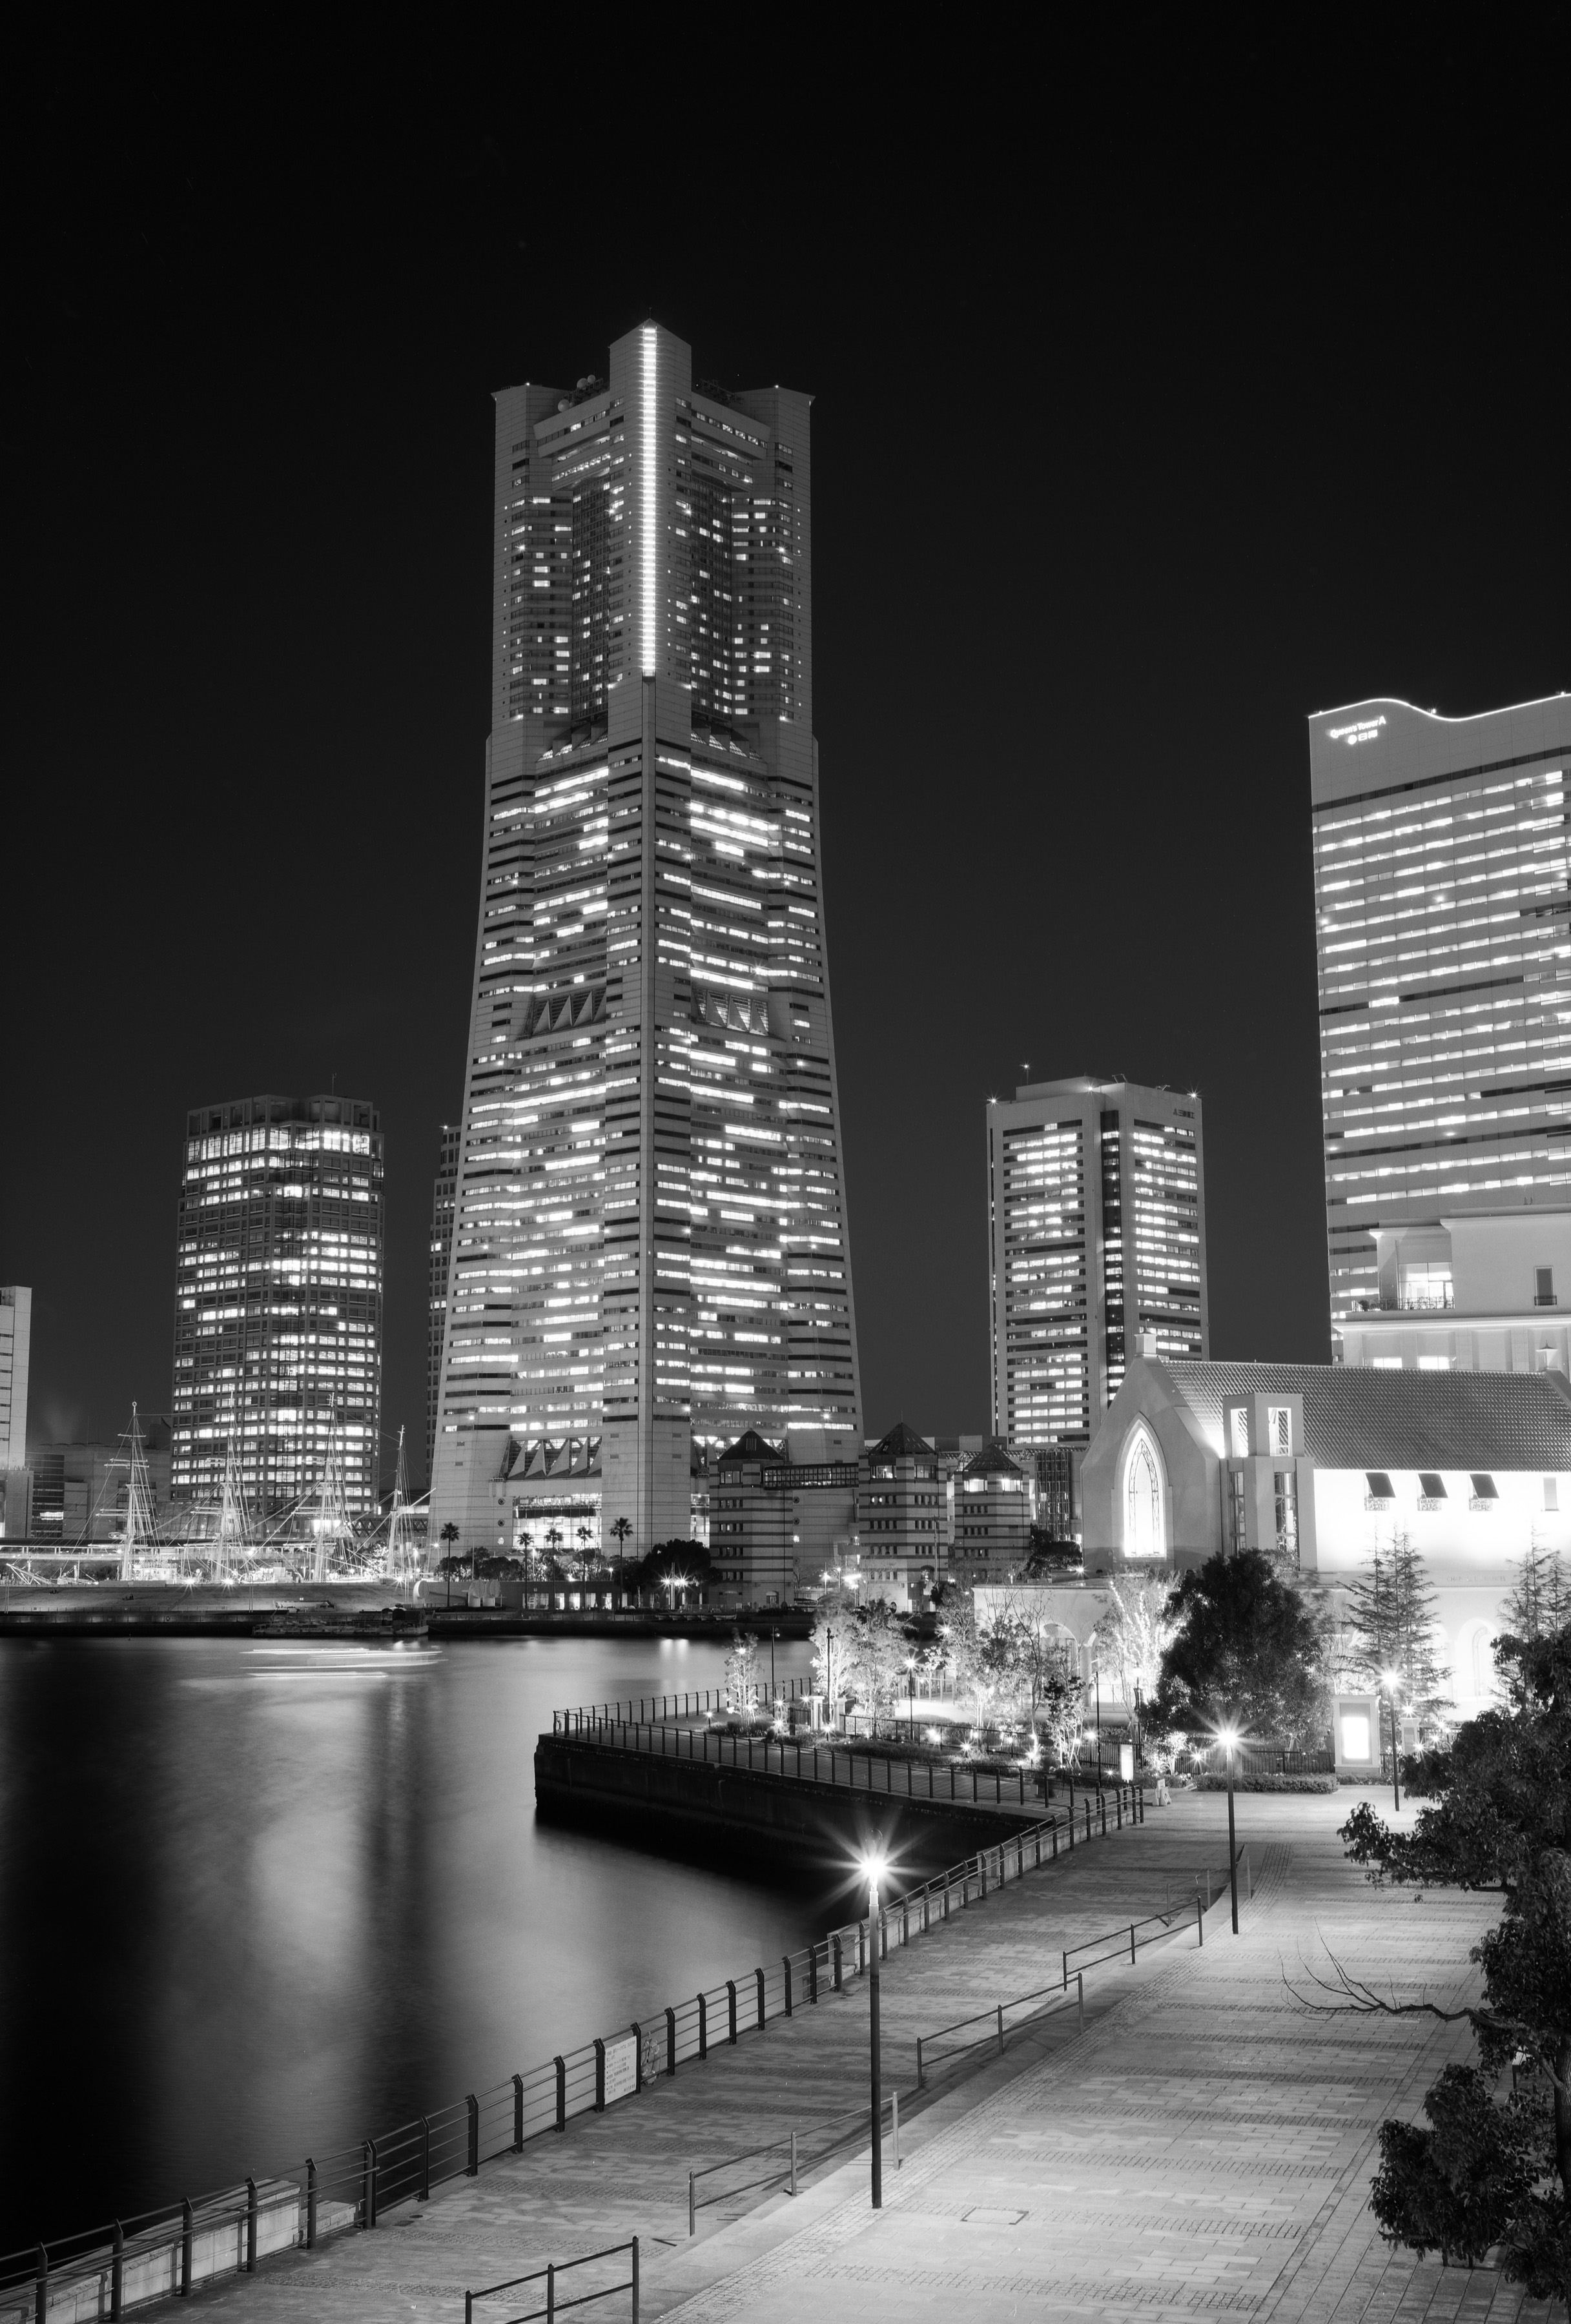
Fuji Acros 100. I set the sidewalk to standard exposure and let wide overexposure latitude of the film do its best job on the highlights. Many parts of this scene are too small to spot meter.
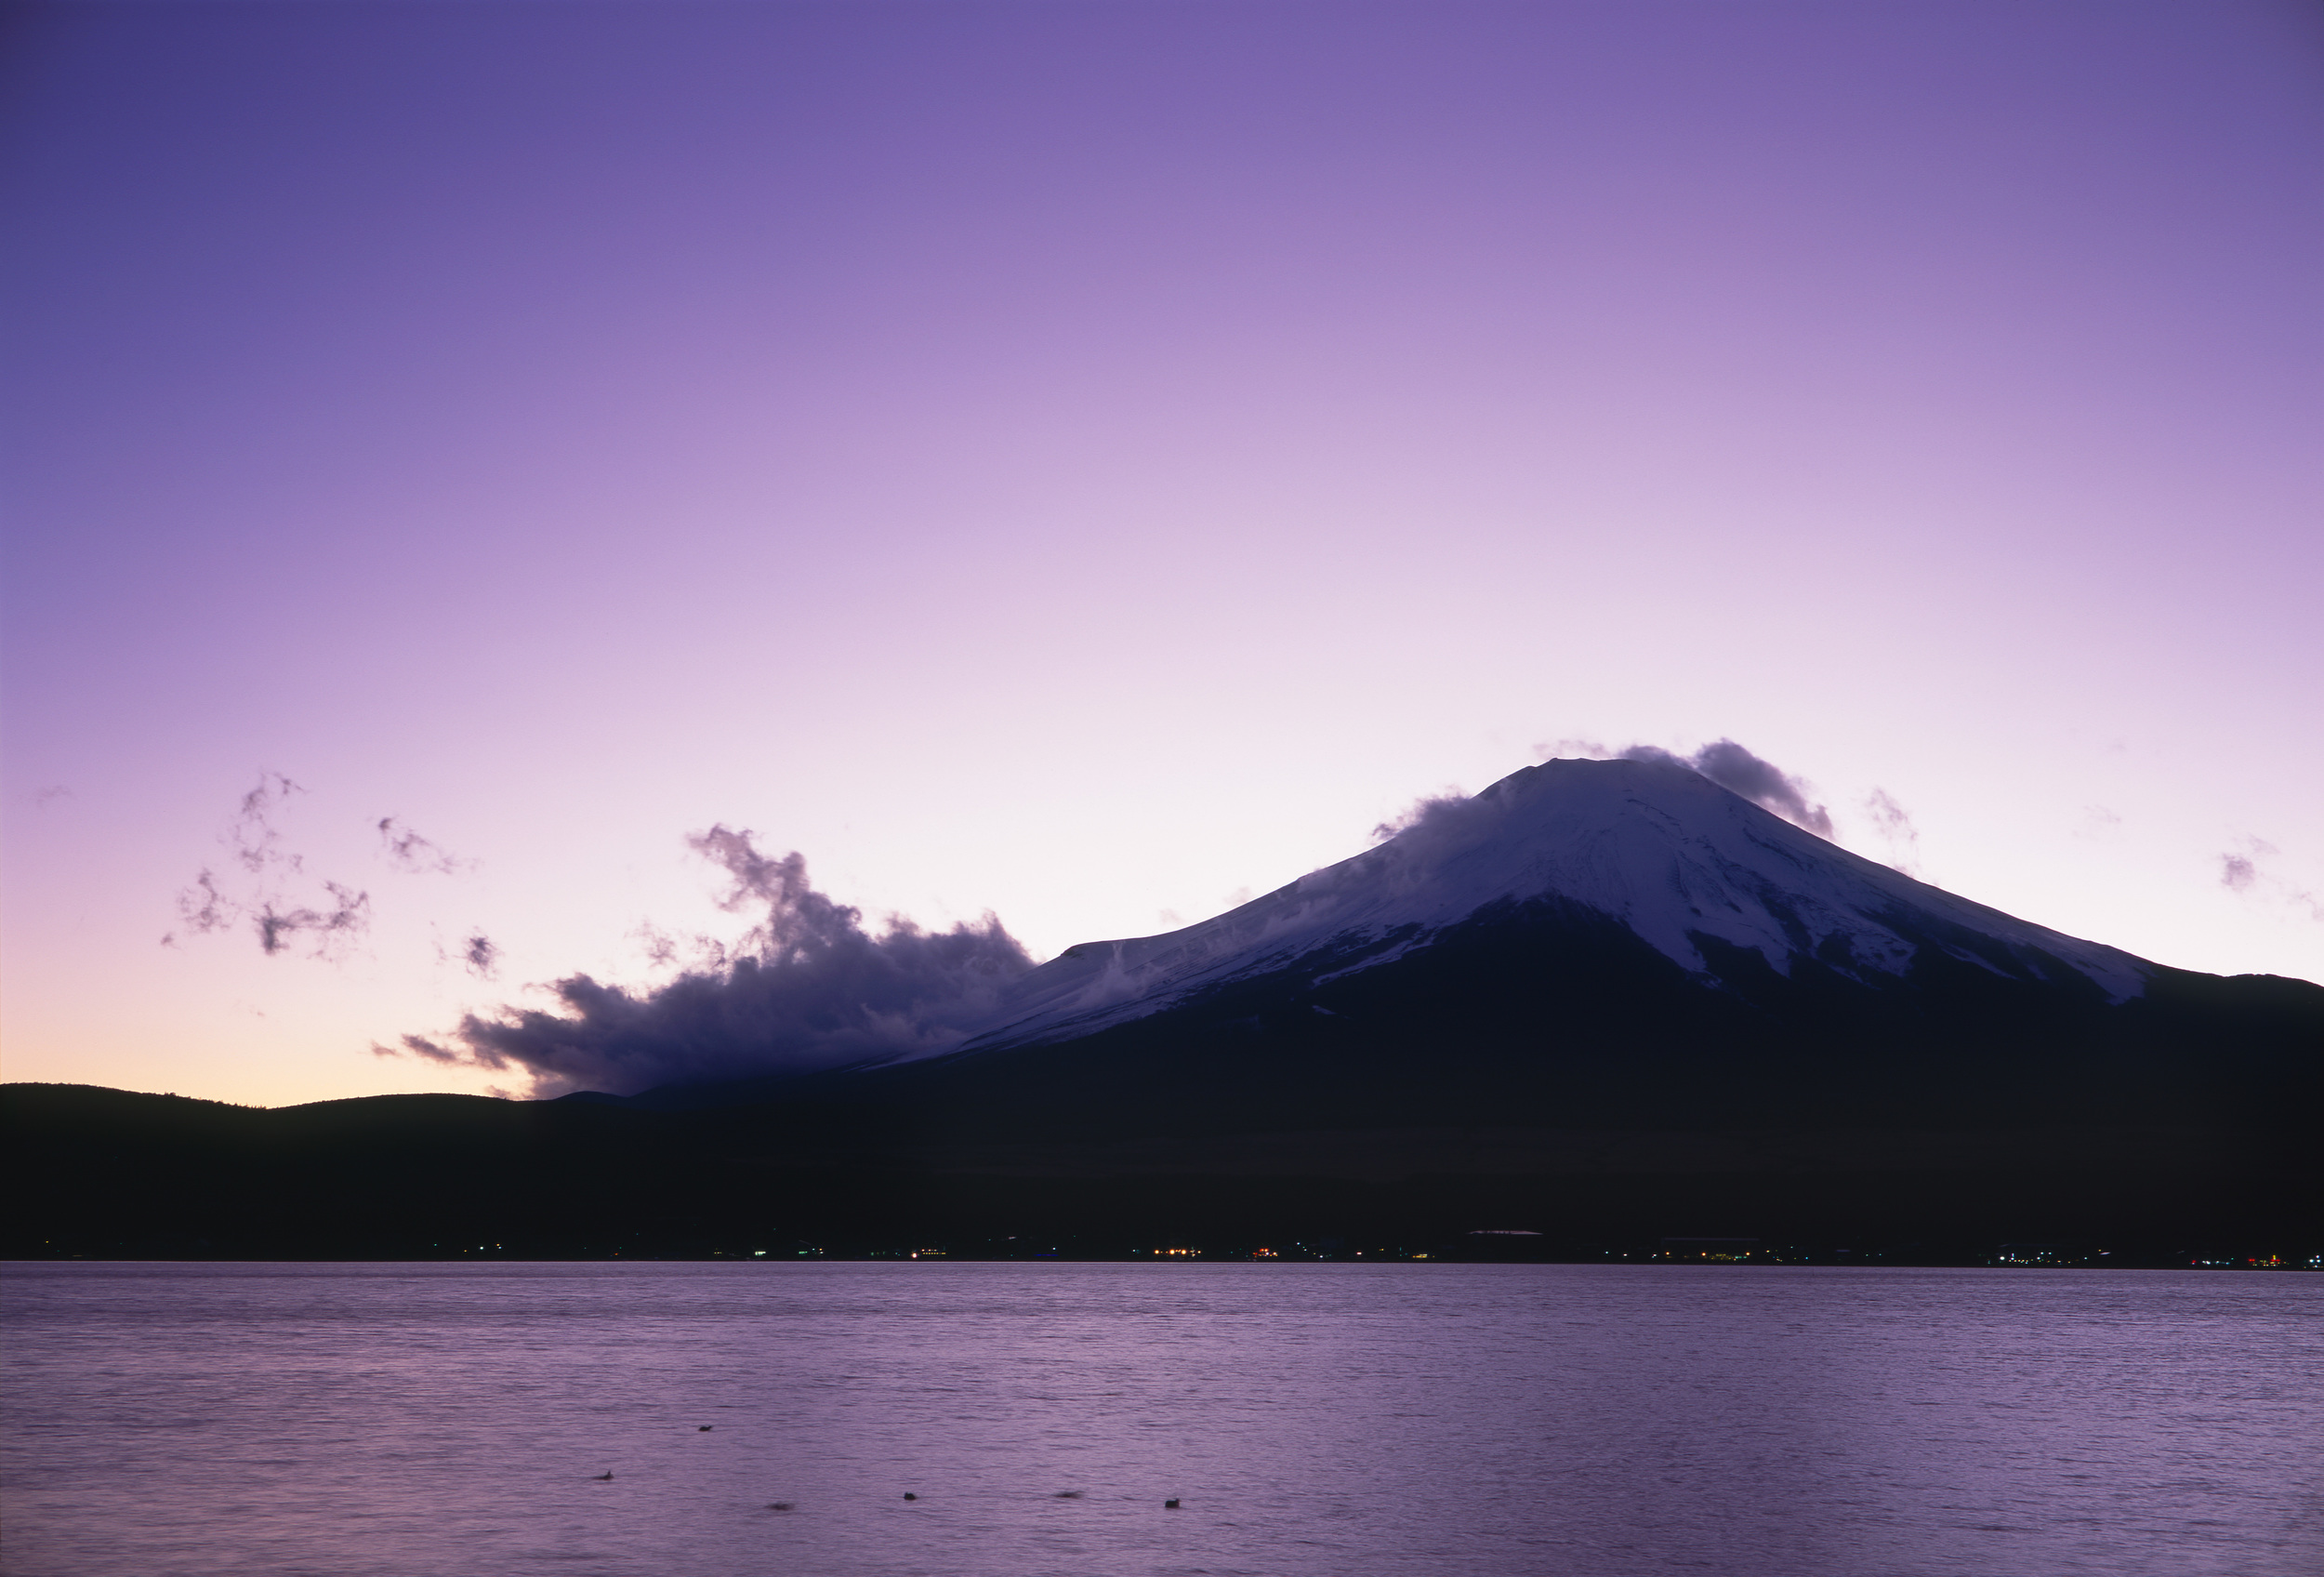
Fuji Provia 100F. I set brightest part of the sky to +3.0 and the dark mountain fell at -3.0, using almost the entire latitude of the namesake film. No filters were used to obtain this photograph.
Mark Schlocker is a Yokosuka, Japan based photographer. Follow him on Facebook.
Equations
(1) The full equation to convert log lux seconds to light meter Δ exposure value
ΔEV = log2 [10Log Lux Seconds – log10(10/ISO)]
(2) Converts a change in log lux seconds to a standard exposure value – or + change
ΔEV = log2 (10 ΔLog Lux Seconds)
(3) Meter reading exposure (middle grey, or 0) in log lux seconds
Log Lux Seconds = log10 (10/ISO)
(4) Converts an exposure – or + change in stops to a change in log lux seconds
ΔLog Lux Seconds = log10 (2ΔEV)
ΔEV = ΔExposure Value (here relating to a meter reading of -1, 0, +1, etc.)
ISO = ISO film speed
log10 = log base 10 which is the standard log
log2 = log base 2
Log as it appears here without a base number is just part of the word “log lux seconds” which represents a set amount of light.
For equation (1) “log lux seconds” represents the reading off the characteristic curve. For equation (2) it represents a shift up or down in lux log seconds, if you want to compare that with a shift up or down in camera stops. For equation (3) it represents the amount of light that produces a standard exposure on a grey card. For equation (4) it represents a shift up or down in lux log seconds, if you want to compare that with a shift up or down in camera stops. Equations (2) and (4) are equal but going in opposite directions.